Take Presidential Polls With a Grain of Salt
If public-opinion surveys are any indication, President Donald Trump is headed for a defeat on November 3rd. The RealClearPolitics no-tossup map, which is based strictly on state polls, predicts that former Vice President Joe Biden will win 337 electoral votes to 201 for Trump. Of the main swing states, only one—North Carolina—is in the Republican column.
The question remains: Do these numbers actually mean anything? Obviously, polls do not vote; people do. However, polls have a certain degree of predictive power and they are useful for examining trends.
The question remains: Do these numbers actually mean anything? Obviously, polls do not vote; people do. However, polls have a certain degree of predictive power and they are useful for examining trends.
In this election cycle, polls should be considered but balanced by considerations of enthusiasm, the time element, dissenting views, and the silent Trump voter theory. Integrating these caveats paints a picture of a 50/50 race instead of the lopsided one predicted by RCP and other prognosticators.
This line of reasoning contends that some Americans support Trump but are unwilling to vocalize that opinion. This factor was not responsible for 2016 polling errors in key swing states (namely Michigan, Pennsylvania, and Wisconsin), but there are data showing that conservatives are unwilling to share their political views.
Enthusiasm:
Trump voters are far more enthusiastic than Biden voters, as measured by two metrics: (1) declared enthusiasm levels and (2) voting rationales.
In April 2020, Emerson College asked respondents how excited they are about their candidate. As I reported on April 29th:
In Emerson College's April poll, which shows Trump behind Biden by six points (48% for Biden to 42% for Trump), 64% of declared Trump voters are "very" or "extremely" enthusiastic about supporting the president's reelection bid. Only 45% of Biden's supporters say the same, and 55% count themselves "mildly" excited or not excited at all about the former vice president's candidacy. Only 37% of Trump voters count themselves "mildly" excited or unexcited.
Trump's supporters are clearly more excited about their candidate than Biden's. A different metric—voters' rationales—sheds more light on this enthusiasm gap. Per an August 2020 CNN/SRSS survey, 38% of Biden's supporters are voting for him personally whereas 58% are voting against Trump. Among Trump's supporters, 67% are voting for the president personally; just 29% are voting against Biden. It is intuitive that voters will be more enthused by their love for a candidate than contempt for his opponent (see: Barack Obama's 2008 candidacy).
Polling naturally considers a static group of people intended to represent the actual electorate. However, the composition of the electorate is driven by factors like enthusiasm: People who are excited about their candidate are more likely to cast a ballot, whereas uninterested people will stay home.
Even if the plurality/majority of the population supports Biden, Trump will win if he nets the plurality/majority of the electorate in key swing states. The excitement level of the president's supporters—and their adherence to him personally—makes his reelection more likely.
The time element:
This factor is oftentimes overstated, but 76 days separate today (August 18th) from Election Day. This is not an insignificant period of time. Between now and then, there will be more speeches from both Democrats and Republicans (i.e., the party conventions), three presidential debates, and a vice-presidential debate. Potentially, bombshell revelations could emanate from Manhattan District Attorney Cyrus Vance's probe of the president, the Senate Homeland Security Committee's investigation of Hunter Biden, and U.S. Attorney John Durham's investigation of Trump's 2016 investigators.
 |
| Data from RCP |
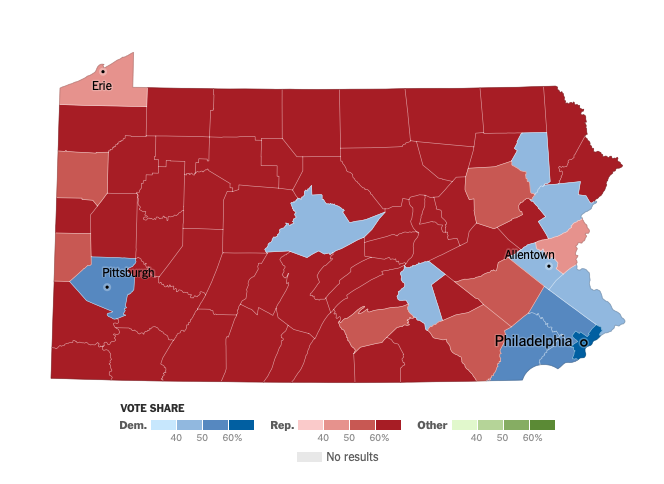
Consider that Trump—who is generally behind in the polls—is outperforming his numbers from four years ago. Then, Democratic nominee Hillary Clinton led by nine points in the RCP average for Wisconsin, 8.5 in Michigan, 8.7 in Pennsylvania, 3.3 in Ohio, and 1.2 in North Carolina. Trump ended up winning all of these states. This time around, Trump is trailing by reduced amounts in WI, MI, PA, and OH and actually leading in N.C. The caveat is that Clinton never commanded a majority in any of these states; Biden is at 50% in WI and flirting with 50% in PA.
Nonetheless, in the past, Trump benefited from the uncertainty that is Father Time. Forecasts that omit this factor are prone to error.
Dissenting views:
Polling averages are most useful for examining trends, but it is important to consider dissenting views. In 2016, the most prominent contrarian—the Trafalgar Group—was alone in calling Trump's come-from-the-behind wins in Michigan and Pennsylvania. Trafalgar also called Trump's victory in Florida, which was somewhat less surprising.
This time around, Trafalgar has Trump up marginally in Florida, behind by one point in Michigan, down five in Pennsylvania, up by one in Wisconsin. If he holds the rest of his 2016 states, Trump can lose Michigan and Pennsylvania and still win reelection.
Trafalgar's 2020 numbers may be off-base, but their 2016 accuracy shows the importance of looking beyond the "mainstream" pollsters.
The silent Trump voter theory:
This line of reasoning contends that some Americans support Trump but are unwilling to vocalize that opinion. This factor was not responsible for 2016 polling errors in key swing states (namely Michigan, Pennsylvania, and Wisconsin), but there are data showing that conservatives are unwilling to share their political views.
According to a poll conducted by the Cato Institute in conjunction with YouGov, 62% of Americans have political views that they are afraid to share out of fear of offending someone else. This concern cuts across partisan lines, but the share of Democrats afraid of expressing themselves (52%) is far lower than the share among Republicans (77%). The Cato Institute's writeup notes, "Strong liberals stand out ... as the only political group who feel they can express themselves."
Cato/YouGov also found that 50% of strong liberals support firing Trump donors and that 36% of strong conservatives support firing Biden voters. "Donors," obviously, are clearly definable thanks to mandatory reporting of campaign contributions. However, with the strong liberal share being 14 points higher, it is plausible that Trump voters are hesitant to express their support for the president out of fearing of being fired or otherwise canceled.
Cato/YouGov also found that 50% of strong liberals support firing Trump donors and that 36% of strong conservatives support firing Biden voters. "Donors," obviously, are clearly definable thanks to mandatory reporting of campaign contributions. However, with the strong liberal share being 14 points higher, it is plausible that Trump voters are hesitant to express their support for the president out of fearing of being fired or otherwise canceled.
It remains to be seen whether conservatives withhold their true opinions from pollsters, but it is statistically more likely that they stay quiet than those on the left. Interestingly, a Fox News poll found that 39% of respondents believe that their neighbors will vote for Trump. Biden trails in the "neighbor vote" with 34%.
Conclusion:
Public-opinion surveys seem to paint a clear picture: Come November 3rd, voters will send Trump packing.
A more holistic review of the election, however, muddies the water. Biden may have more raw support but fall short because he is unable to motivate his supporters to vote. The president's support may be underestimated by mainstream pollsters because conservatives—who, by and large, support Trump—are afraid of expressing their views. Most unpredictably, Trump could once again benefit from unexpected shifts between mid-August and Election Day.
 |
| Betting odds over time (RCP) |
With these considerations taken into account, the election is a coin toss. The people who put their money where their mouth is—political bettors—are approaching this point of view: The president's odds improved from 36.4% on August 1st to 41.7% today.

Comments
Post a Comment